deepsouth
somebody shut me the fark up.
- Joined
- Apr 21, 2010
- Location
- Biloxi, MS
http://www.vox.com/2014/6/20/582582...-all-the-worlds-cattle-chickens-and-pigs-live
The Earth currently has 19.6 billion chickens, 1.4 billion cattle, and 980 million pigs. If you added up all the world's livestock, they'd weigh more than humans and all other wild animals combined.
There are 19.6 billion chickens, 1.4 billion cattle, and 980 million pigs.
So where do those chickens, cattle, and pigs actually live?
Glad you asked! Ben Schiller of Co.Existpoints to a fascinating new set of maps laying out global livestock patterns around the world. We can now pinpoint the location of chickens, cows, pigs, and ducks down to the square kilometer. (Maps of sheep and goats are still forthcoming.)
As the researchers point out in an accompanying paper published in PLOS One, these maps are useful for tracking the environmental impact of ever-expanding livestock production as well as keeping tabs on the potential spread of disease like avian flu. So let's check it out (you can zoom in on the maps here):
Here's where the world's cattle are
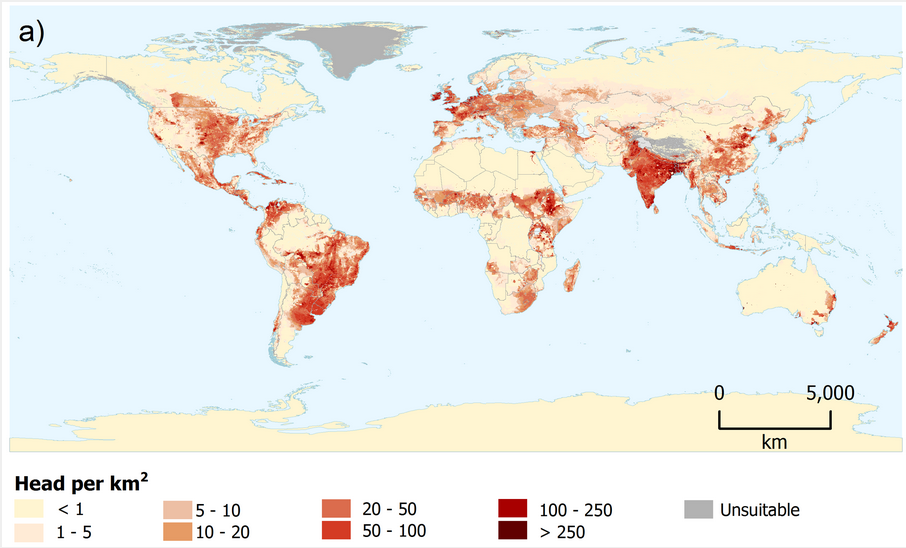
Robinson et al 2014
This one's straightforward: The density of cattle is highest in India, in east Africa, in northern Europe, and in South America. China's got plenty of cattle, although the country is less important here than it is for other types of livestock.
Here's where the world's chickens are
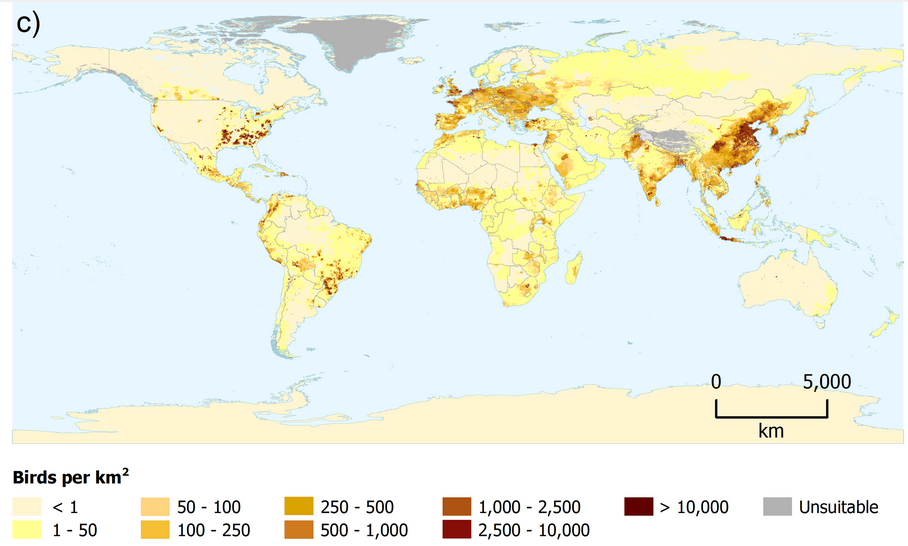
Robinson et al 2014
By and large, chicken populations tend to track human populations pretty closely — chicken production isn't quite as dependent on finding suitable pasture as, say, cattle is. The highest densities are in eastern China, in Pakistan and India, and in western Europe.
The United States is worth highlighting here — lots of chickens on the densely populated East Coast and in the South, but very few in the central and western states.
The researchers who made these maps were also, for the first time, able to disaggregate chicken and duck distributions. That's useful for people trying to track the spread of diseases like the avian flu — particularly in places like China where both chickens and ducks are raised.
Here's where the world's pigs are
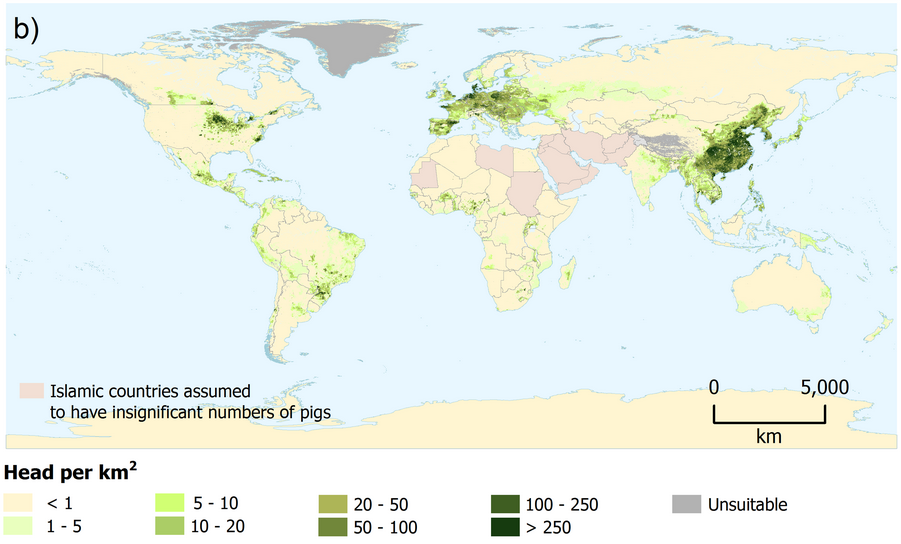
Robinson et al 2014
China is responsible for half of the world's pork supply, and you see that on the map — the world's densest concentrations of pigs are in eastern China. Pigs are also relatively rare in Africa outside a handful of countries (Uganda, Burkina Faso, Ghana, Nigeria, and Togo).
* Also, one key side-note on all this: many researchers have argued that China's statistics on meat production are unreliable, as local officials have incentives to inflate their production numbers. The problem seems to be especially flagrant in the pork industry, and it's possible that pork numbers are lower than available data suggests.
And livestock production is expected to keep rising…
So why map livestock? In part because livestock is such a dominant force on the planet — in both good ways and bad.
Demand for meat is expected to rise 73% between 2010 and 2030.
Livestock is already responsible for both the food and livelihoods of roughly 1 billion people on the planet. And, the authors of the PLOS One paper note, that number is expected to skyrocket in the decades ahead.
As developing countries get richer, demand for meat is expected to rise 73 percent between 2010 and 2030. Demand for milk is expected to rise 58 percent, according to the UN Food and Agriculture Organization. (Though the rate of demand growth is expected to level off in China and Brazil.)
That's likely to put heavier pressure on the environment. Livestock is already responsible for some 14.5 percent of the man-made greenhouse-gas emissions that are warming the planet. Animal manure can disrupt the nitrogen cycle or contaminate waterways.
Then there's health to consider. As the livestock sector keeps expanding, people, cattle, chickens, and pigs are all pushed in closer proximity with wild habitats — raising the possibility of infectious pathogens spreading. And the use of antibiotics in the livestock sector increases the odds of antibiotic-resistant bacteria developing.
Obviously these aren't easy issues to address. But, the PLOS One authors note, better maps are a good start. They note that the maps have already been used to estimate the environmental impact of livestock and to study avian flu or foot-and-mouth disease.
The maps are expected to keep getting better over time, as the model used to estimate livestock improves. The authors also note that they are working on maps for the world's 1.87 billion sheep and goats.
* Update. Added note about Chinese statistics and a citation to recent work on this.
The Earth currently has 19.6 billion chickens, 1.4 billion cattle, and 980 million pigs. If you added up all the world's livestock, they'd weigh more than humans and all other wild animals combined.
There are 19.6 billion chickens, 1.4 billion cattle, and 980 million pigs.
So where do those chickens, cattle, and pigs actually live?
Glad you asked! Ben Schiller of Co.Existpoints to a fascinating new set of maps laying out global livestock patterns around the world. We can now pinpoint the location of chickens, cows, pigs, and ducks down to the square kilometer. (Maps of sheep and goats are still forthcoming.)
As the researchers point out in an accompanying paper published in PLOS One, these maps are useful for tracking the environmental impact of ever-expanding livestock production as well as keeping tabs on the potential spread of disease like avian flu. So let's check it out (you can zoom in on the maps here):
Here's where the world's cattle are
Robinson et al 2014
This one's straightforward: The density of cattle is highest in India, in east Africa, in northern Europe, and in South America. China's got plenty of cattle, although the country is less important here than it is for other types of livestock.
Here's where the world's chickens are
Robinson et al 2014
By and large, chicken populations tend to track human populations pretty closely — chicken production isn't quite as dependent on finding suitable pasture as, say, cattle is. The highest densities are in eastern China, in Pakistan and India, and in western Europe.
The United States is worth highlighting here — lots of chickens on the densely populated East Coast and in the South, but very few in the central and western states.
The researchers who made these maps were also, for the first time, able to disaggregate chicken and duck distributions. That's useful for people trying to track the spread of diseases like the avian flu — particularly in places like China where both chickens and ducks are raised.
Here's where the world's pigs are
Robinson et al 2014
China is responsible for half of the world's pork supply, and you see that on the map — the world's densest concentrations of pigs are in eastern China. Pigs are also relatively rare in Africa outside a handful of countries (Uganda, Burkina Faso, Ghana, Nigeria, and Togo).
* Also, one key side-note on all this: many researchers have argued that China's statistics on meat production are unreliable, as local officials have incentives to inflate their production numbers. The problem seems to be especially flagrant in the pork industry, and it's possible that pork numbers are lower than available data suggests.
And livestock production is expected to keep rising…
So why map livestock? In part because livestock is such a dominant force on the planet — in both good ways and bad.
Demand for meat is expected to rise 73% between 2010 and 2030.
Livestock is already responsible for both the food and livelihoods of roughly 1 billion people on the planet. And, the authors of the PLOS One paper note, that number is expected to skyrocket in the decades ahead.
As developing countries get richer, demand for meat is expected to rise 73 percent between 2010 and 2030. Demand for milk is expected to rise 58 percent, according to the UN Food and Agriculture Organization. (Though the rate of demand growth is expected to level off in China and Brazil.)
That's likely to put heavier pressure on the environment. Livestock is already responsible for some 14.5 percent of the man-made greenhouse-gas emissions that are warming the planet. Animal manure can disrupt the nitrogen cycle or contaminate waterways.
Then there's health to consider. As the livestock sector keeps expanding, people, cattle, chickens, and pigs are all pushed in closer proximity with wild habitats — raising the possibility of infectious pathogens spreading. And the use of antibiotics in the livestock sector increases the odds of antibiotic-resistant bacteria developing.
Obviously these aren't easy issues to address. But, the PLOS One authors note, better maps are a good start. They note that the maps have already been used to estimate the environmental impact of livestock and to study avian flu or foot-and-mouth disease.
The maps are expected to keep getting better over time, as the model used to estimate livestock improves. The authors also note that they are working on maps for the world's 1.87 billion sheep and goats.
* Update. Added note about Chinese statistics and a citation to recent work on this.